
Why I built LogDog?
LogDog is the result of a classical scratch your own itch problem. I was frustrated with the lack of tools available to debug my mobile apps. Trying to fill this niche is with a solution that would make debugging on both iOS and Android seamless, powerful, and accessible to everyone on a team.
Let's start with a deep dive into existing tools and solutions. Don't get me wrong you find a lot of good solutions and concepts in native debugging tools in iOS and Android. I found useful tools in XCode and Android Studio. Especially in the last 2-3 years a lot of improvements have been introduced. Another source of inspiration in the field of debugging tools is Chrome DevTools. Having spent many years using it resulted in a big impact on how I crafted my own solution.
A key problem is that you never get all of the features of the mentioned tools in one software that works on both platforms. Apple is doing its own job and of course does in no way align with Android or vice versa. This means that developers always have to switch between tools and platforms and results in always at least 2 times setup time and 2 times a learning curve.
This insight defined the first argument to build LogDog.Another finding was that these native debuging tools usually are bound to the IDE. IDEs are heavy by default and come with lots of other features. As a result I see this as a limitation for people working in tech but not directly in the field of software development. This applies to Testers, Product Owners, Managers and other people working in tech.
Out of this another requirement for LogDog to be lightweight, easy to setup and of course easy to use was formed.
One area where debugging becomes a pain is when data is entering or leaving your application. Analyzing network traffic is on the other hand a very important part to understand the behavior of an application. The tooling around this is not as mature as I would like it to be. This is especially true when it comes to request interception and mocking. This point proved to me more evidence to work on a solution.
When we talk about denugging in general then working with logs is a key part of the process.
The five logging scenarios
In my daily work I differentiate between 5 different logging scenarios.Scenario 1: Time based scenarios - Short term
I have a problem in my application and to narrow down the problem I need to log something. The area in the code where the problem is located roughly located and within a few minutes of logging the problem can be solved.
Scenario 2: Time based scenarios - Long term
The problem is I am trying to solve is yet excactly located. Additionally they it is not easy to reproduce because scpeific conditions (which are not known) are required. So catching it requires some patience and logs need to be collected over time.
Scenario 3: Volume based
The application to be investigated is complex. It produces huge amounts of logs. Finding the relevant logs is a challenge.
Scenario 4: Device based
The problem to solve occurs only on specific device. Of course these devices are not always accessible or in reach.
Scenario 5: Setup based
In the moment a specific problem occurs the device is not in the right state to be investigated. With this I refer to the challenge to catch bugs in production builds.
What a good debugging tool needs
The described scenarios are very familiar to many developers and regularly cause a lot of frustration. Besides the frustration they also impose some requirements on our logging.Let's summarize the requirements on debugging/logging:
- It needs to be persistent
- It should be possible to filter, search and group logs
- Logging should be active at all times or at least can be activated on demand
- It should work independently of the build type I have on my device (TestFlight, Release-, Debug-Build etc.)
- It should work independently of the device type
- It should be as frictionless as possible to use - access to the logs with as little effort as possible
- Logging should happen automatically wherever data is entering or leaving the application (request interception)
These corner-stones were the foundation to start working my way towards a solution. Let me now explain how LogDog solves these problems.
LogDog is built as a native SDK for iOS and Android. This means it becomes part of your application and brings several advantages:- It has full context of the application.
- It works with any build type
- It can enhance the debugging experience with additional UI (debug windows)
- Debugging network requests requires no bulky setup with certificates
- We can request additional permissions (like camera, microphone, location, etc.) directly from the app
Undeniably this also brings some potential drawbacks:
- Updating the SDK requires a new build of the application
- It increases the size of the application
- It can potentially affect the performance of the application
As mentioned: I see requests or any network traffic also as a part of the logging/debugging process. Therefore my goal was to bring request interception/mocking and "classical" logging into one tool. This also defines a clear distinction from other tools that focus on proxy based solutions. With proxy based request interception/mocking is possible but it lacks the ability to have the logging and also misses the ability to include important contextual background information to enrich the debugging experience. Therefore I ruled out any proxy based approach for LogDog.
To tackle increase of the bundle size LogDog omits any heavy external dependencies. To achieve this LogDog relies only on native solutions for most of its functionality. One example is storage. Here the iOS SDK uses native user defaults as well as SQLite. Both come as part of the os and help to keep the SDK as lightweight as possible.
There is one exception to this. This lies in the fact that LogDog also allows you to stream the device screen to the web dashboard. This works via WebRTC. WebRTC itself is a heavy dependency. Therefore I decided to ship the LogDog SDK in two versions. One with WebRTC and one without. This brings a 10 MB difference in final build size.
Let's now talk more about typical use cases and how LogDog can help you.
Use case 1: You want to gain a better understanding of the application
Over time apps can become complex. Requirements change over time and new features are added. In my career I have seen many applications where the amount of logs or networks requests on a fresh app start is overwhelming. This can easily result in unforeseen side effects and application behaviour that is no longer following an efficient or originally intended flow. To make things transparent it is important to see what is happening at what time and especially important in what order.Very often different dependencies within an application have some kind of relationship towards each other. Due to the async nature of many processes this can easily break things.
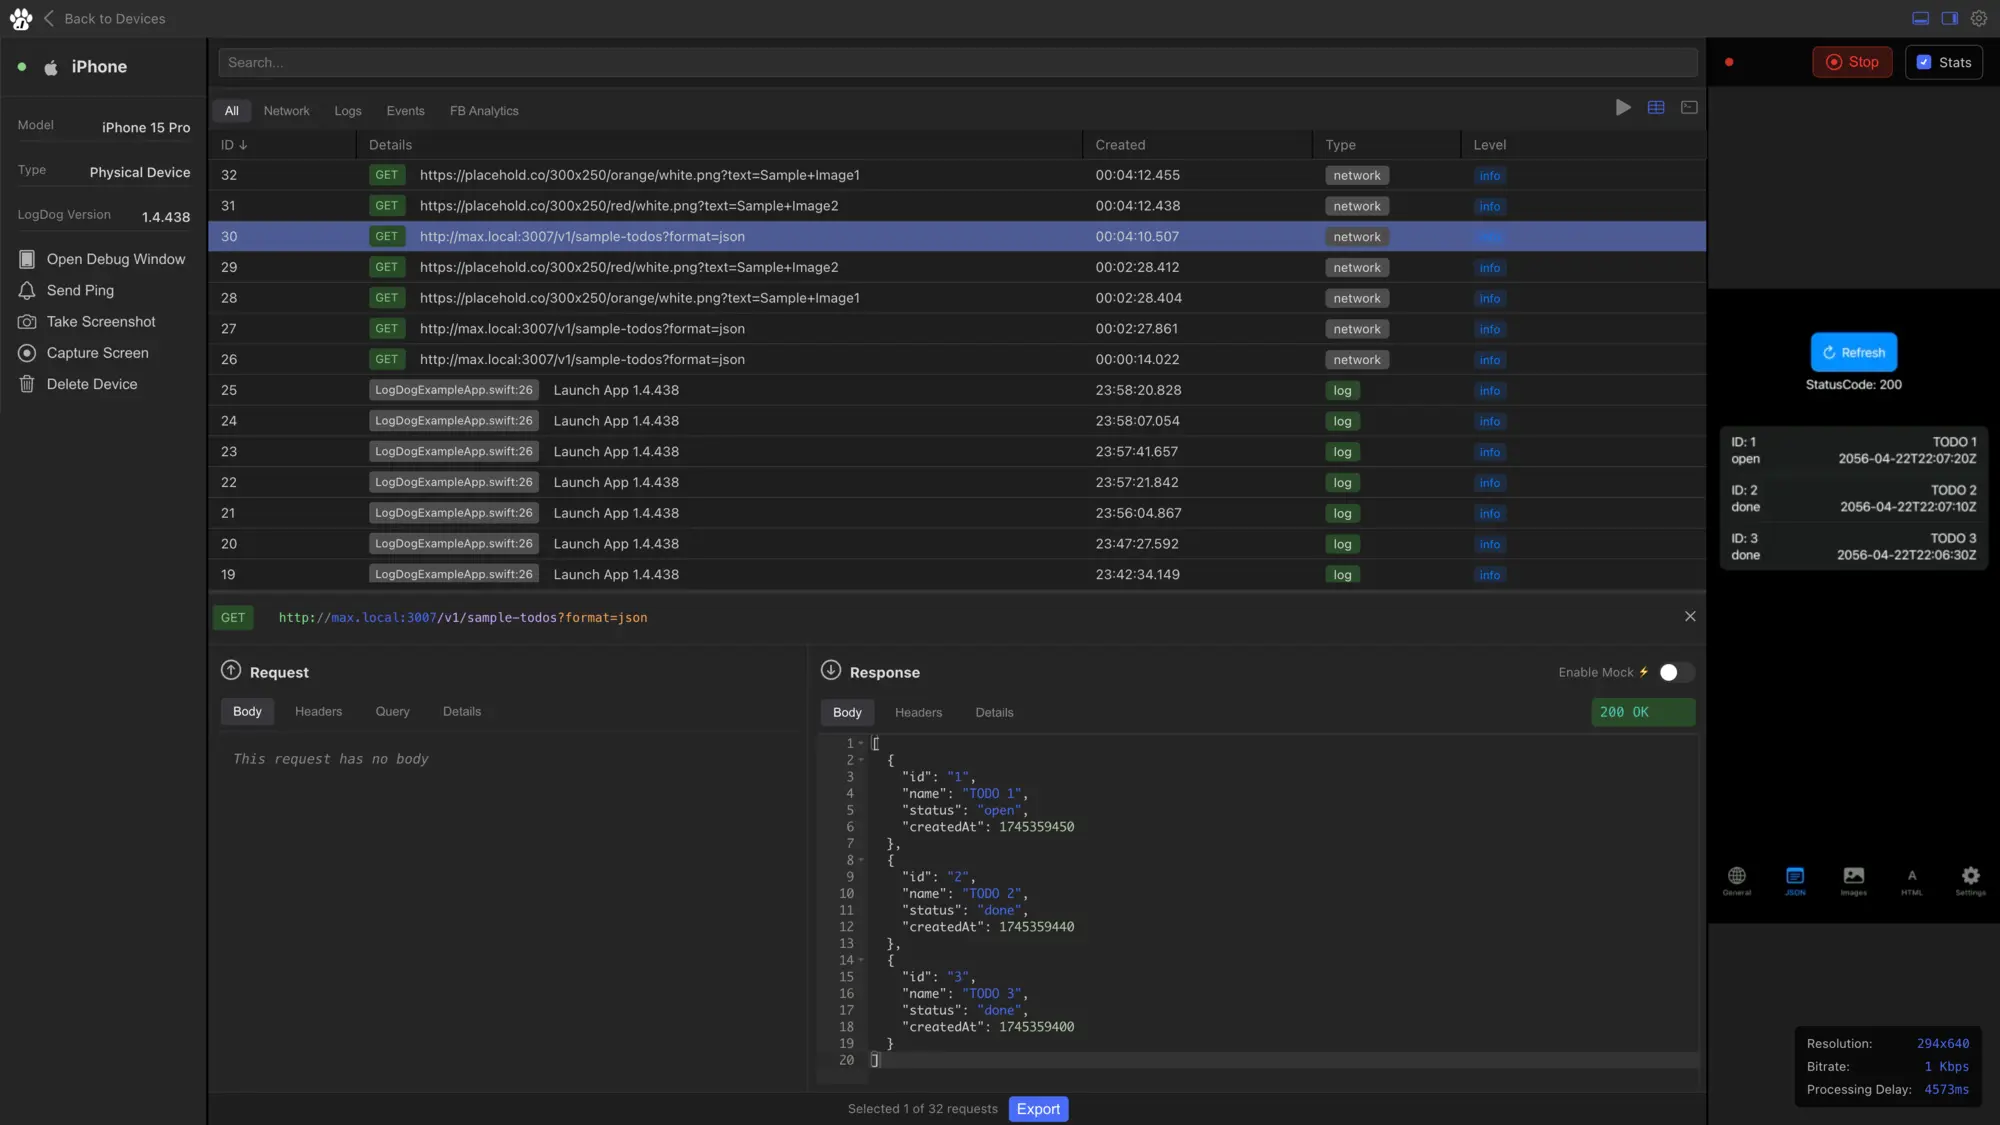
One very typical scenario is the alignment with GDPR. Most apps have some kind of tracking/analytics in place. But to align with GDPR a CMP needs to be presented to the users until permission to start the tracking has been granted. If you want to analyze an application's network traffic and logging a lot of manual logging and breakpoints are required. With LogDog this is simplified. Every request and response is logged automatically and can be seen and filtered from the Dashboard. This helps you to see the exact order of events and also helps to identify potential long running tasks that slowdown your application.
Use case 2: You develop a new feature against a not yet released API/route
This is a classical scenario in cross functional teams. Not always the assigned tickets can be processed in perfect alignment resulting in potential blockers. So how is this solved as of now: One solution is to build your own little mock server that handles the requests and responses. Here multiple techniques are known.- Mocking the API with a locally running server
- Mocking the API with a proxy server
- Mocking the API with a tool like Postman/Insomnia etc.
- Mocking the API inside the code itself by serving a hardcoded response
All of these approaches have one thing in common. They require some kind of setup and some of them require you to rebuild the application in case of changes. Additionally some are limited to the local environment of the used device. Depending on what needs to be mocked (headers, response, status code, etc.) this can be even more complex to setup.
With LogDog all of these obstacles can be avoided easily. Due to its integration into the app it runs all the time or can be easily activated on demand. It is also not limited to specific routes or endpoints. A mocked response can be edited on the fly and does not require a rebuild of the application. Additionally it does not make a difference if the build type is TestFlight, Release or Debug nor does it require to be connected to a specific local network. The flow of developing a new route is completly independent from the backend team. This means while the backend is still in development the frontend can be developed simultaneously and blocking scenarios are avoided.
To make this process seamless LogDog offers a simple editor to iterate on the mocked response together (backend and frontend). Once an agreement is reached each team can continue working on their respective parts. Small changes and iterations can happen on the fly.
Use case 3: A colleague has experienced a rare bug but is not able to reproduce it
Very often these kinds of bugs are time consuming. A lot of time is spent trying to figure out the exact scenario that led to the bug. Due to limited technical knowledge of the person who has experienced the bug the contextual depth of available information is limited. It is very common that tickets for bugs like these spent a very long time in the backlog.With LogDog it is easy to bring in that missing context information. All logs created are logged automatically and immediately to the dashboard. Logs are persisted and can be accessed at any time later.
From here it is easily possible to understand what happened before and after the bug has occurred. There is no need to setup a specific build and wait until the next occurrence nor is it required to manually extract logs via cables from a tester's device. This dramatically cuts the average time from when a bug is discovered for the first time until it is understood, reproduced and fixed.
I hope these words were helpful to understand the origins of LogDog. I am curious to hear about your most challenging debugging stories and if LogDog was able to help you with them Send me an email to support@logdog.app or reach out on social media. I am looking forward to hearing from you!